
Python
Python vs C++ Procedural Programming Compared
Compare Python vs C++ procedural programming with an interactive simulator. See execution flow, memory handling, and performance differences step-by-step.
10 min read
Loading...
Explore our collection of tutorials, guides, and insights to help you master Python and beyond.
Compare Python vs C++ procedural programming with an interactive simulator. See execution flow, memory handling, and performance differences step-by-step.

See the real difference between strong and eventual consistency. Interactive simulator shows how banks and social media make different choices.

Master distributed systems fundamentals. Learn why we distribute, what breaks, core vocabulary, and trade-offs with interactive visualizations.

Master database replication patterns. Compare single-leader, multi-leader, and leaderless topologies with interactive visualizations and real-world examples.

See how one failing service crashes your entire system. Learn the mechanics behind AWS and Facebook outages.

Learn why 3Sum reduces to sorted Two Sum. Interactive visualizer shows how fixing one element and using two pointers drops O(n³) to O(n²).

Learn why water at each bar depends on its tallest neighbors. Interactive visualizer shows how two pointers find trapped water in one pass.

Learn why the shorter wall limits everything. Interactive visualizer shows how two pointers eliminate entire rows of possibilities in one pass.

See why Next Permutation is about finding the rightmost ascent. Interactive visualizer shows how one scan from the right transforms O(n!) brute force into O(n).

Learn how Instagram Explore uses ML to recommend content. Understand two-tower models, candidate generation, and real-time ranking.

Learn the Hough Transform with our interactive simulator. Understand how edge points vote in parameter space to detect lines in images.

Learn image pyramids with our interactive simulator. Understand Gaussian and Laplacian pyramids for multi-scale image processing and seamless blending.

Learn optical flow with our interactive simulator. Understand Lucas-Kanade and Horn-Schunck methods for motion estimation in computer vision.

Master the Gaussian distribution with our interactive calculator. Learn the formula, understand the bell curve, and calculate probabilities step by step.

Master the binomial distribution with our interactive calculator. Learn the formula, explore probability tables, and calculate variance step by step.

Learn the Poisson distribution with our interactive calculator. Understand the formula, explore real examples, and master probability calculations step by step.

Learn how to calculate probability with our interactive calculator. Master the conditional probability formula and law of total probability step by step.

Learn how Netflix deploys code to 200+ million users with zero downtime using blue-green deployment. A deep-dive case study into their deployment architecture.

Learn how Google safely deploys to billions of users using canary releases. A deep-dive case study into their progressive rollout strategy.

Learn how Discord stores trillions of messages and why they migrated from MongoDB to Cassandra to ScyllaDB. A deep-dive into their database evolution.

Learn how Facebook scaled Memcached to handle 1 billion users with billions of requests per second. A deep-dive into their distributed caching architecture.

See why Two Sum is just an existence check. Interactive visualizer shows how one equation turns O(n²) brute force into O(n) with hash maps.

Learn how MongoDB works from first principles. Interactive simulators for document storage, BSON structure, indexing, and the aggregation pipeline.
See PostgreSQL internals: 8KB pages, B-tree indexes, MVCC concurrency, and WAL durability. Interactive visual guide.
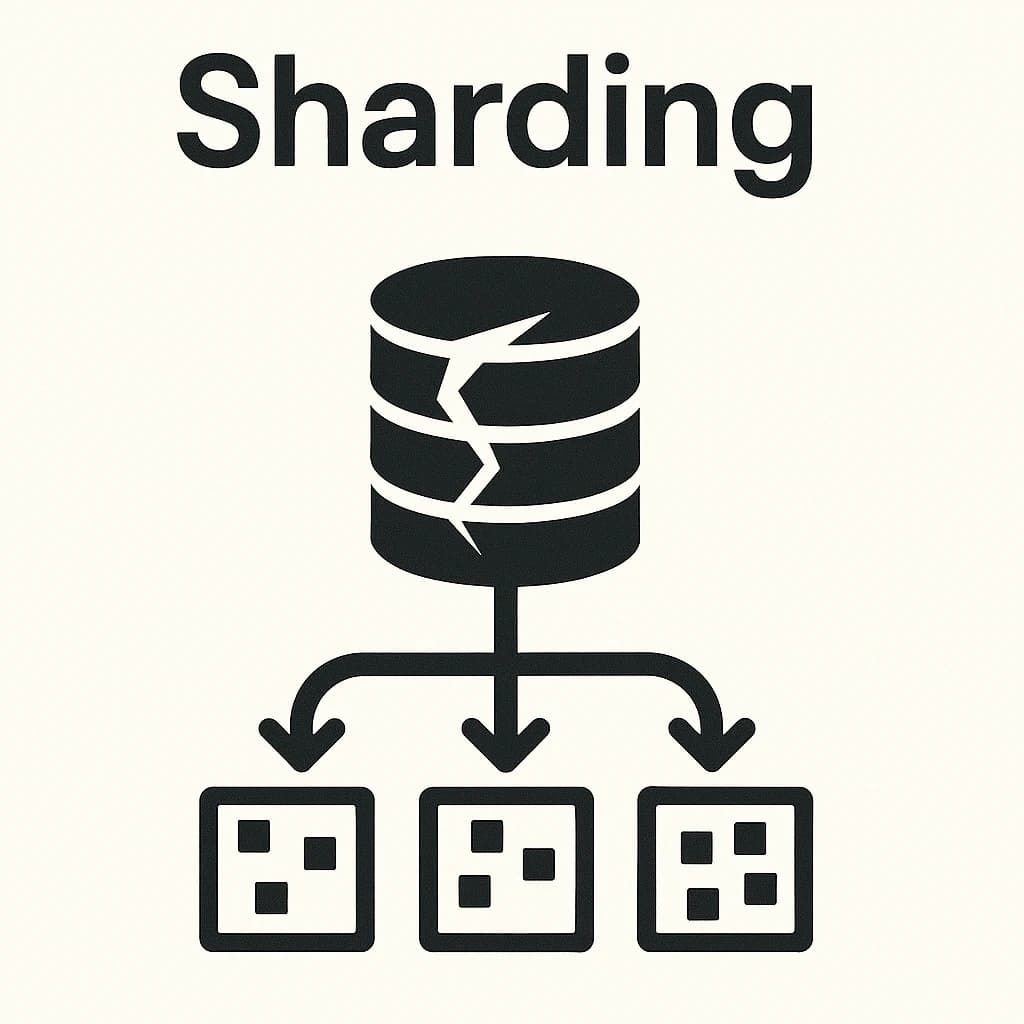
See why single databases fail at scale. Interactive guide to sharding strategies with Python implementation.
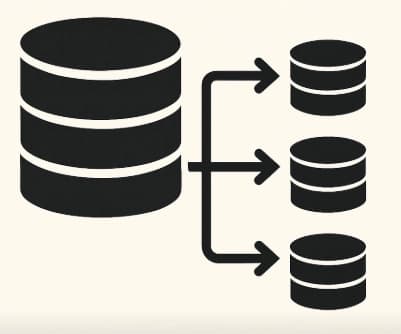
See why single databases fail. Interactive guide to primary-replica replication with Python implementation.
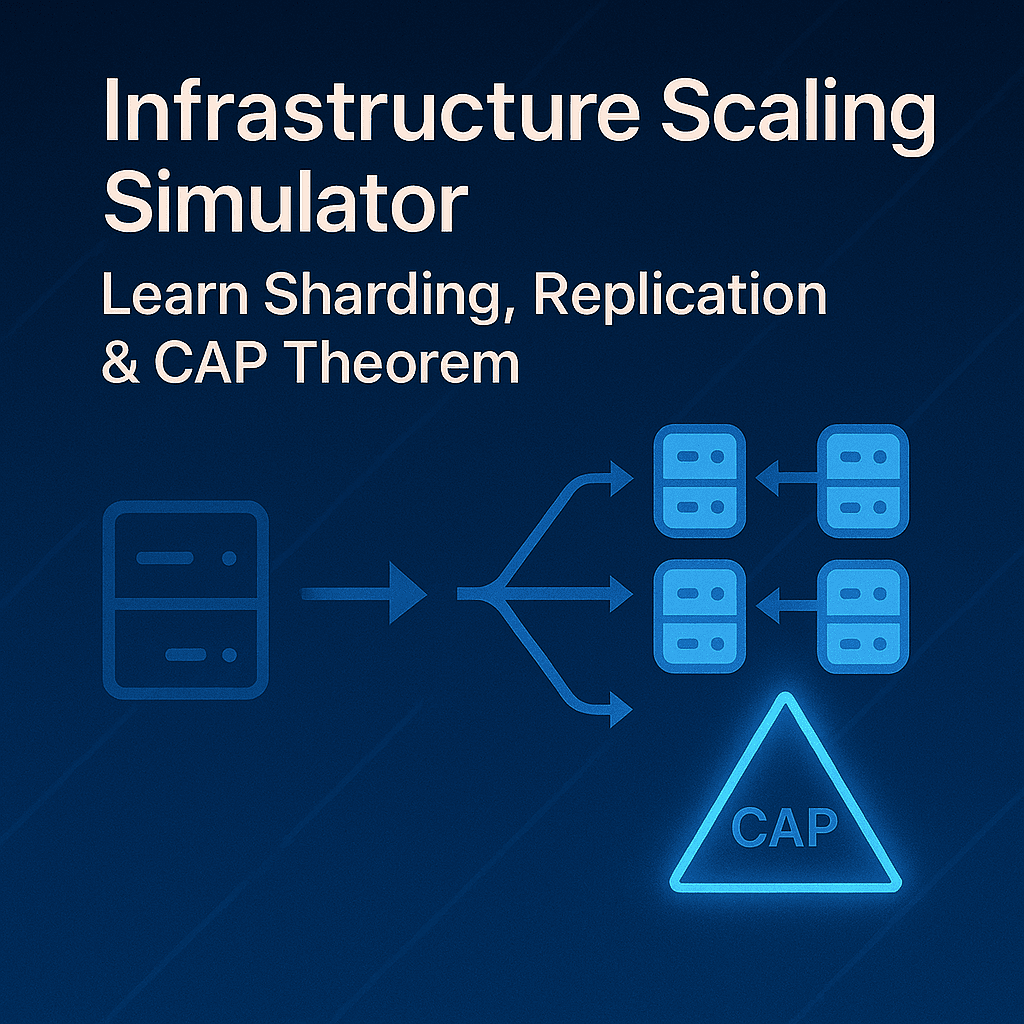
Interactive SimCity-style simulator where you build and break infrastructure. Add shards, replicas, and watch cascade failures teach you system design.

Visualize how quantum computing differs from classical computing. Interactive maze simulator shows superposition, interference, and wave function collapse.
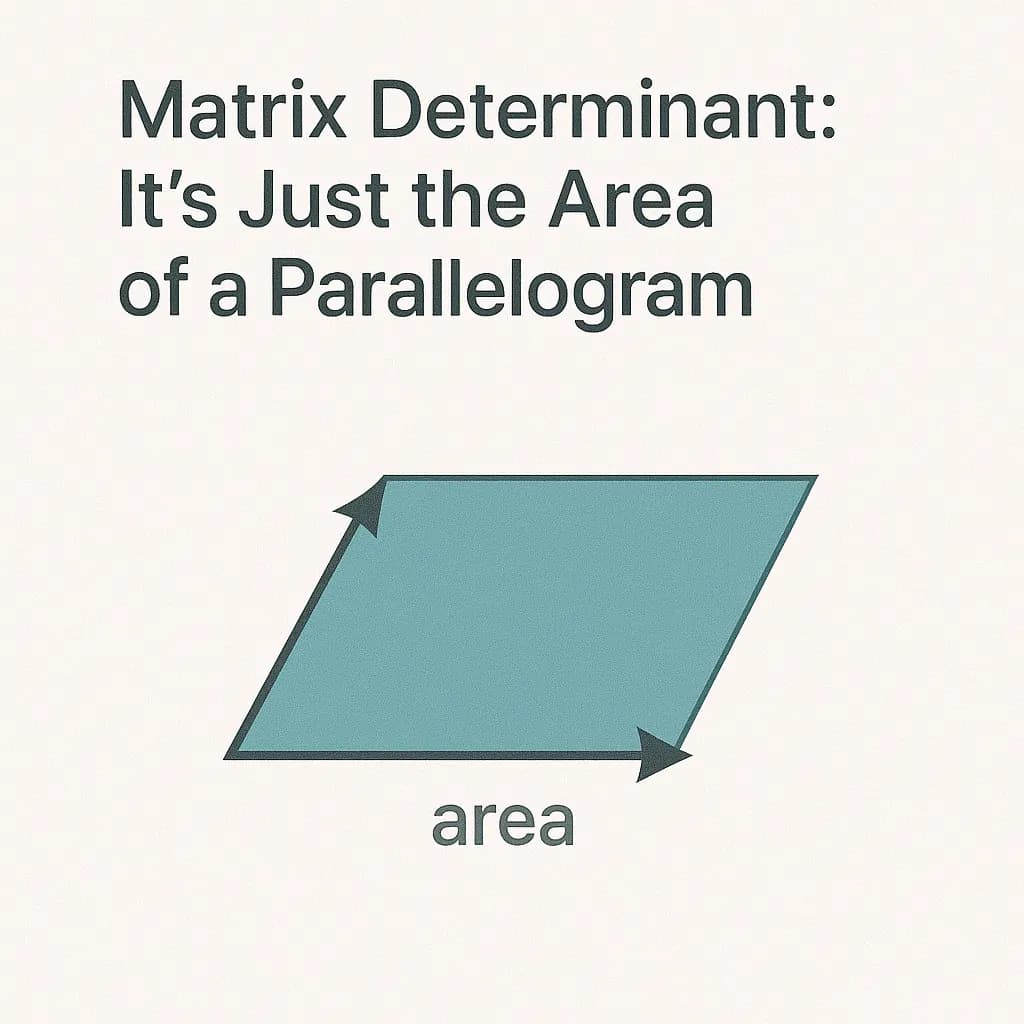
The determinant is just the area of the parallelogram formed by the column vectors. Interactive calculator shows how columns create parallelograms.
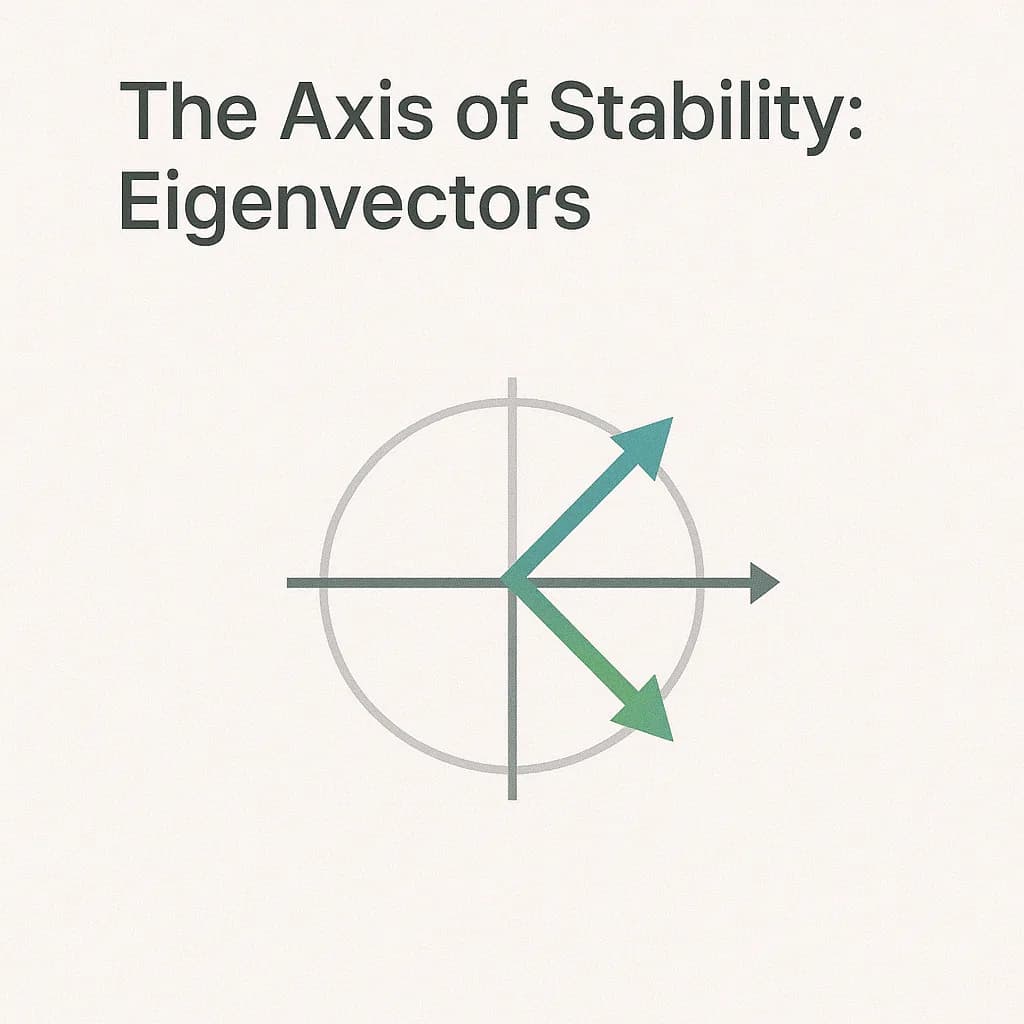
Understand eigenvectors through the spinning globe analogy. Interactive calculator to find eigenvectors and eigenvalues of any 2x2 or 3x3 matrix.
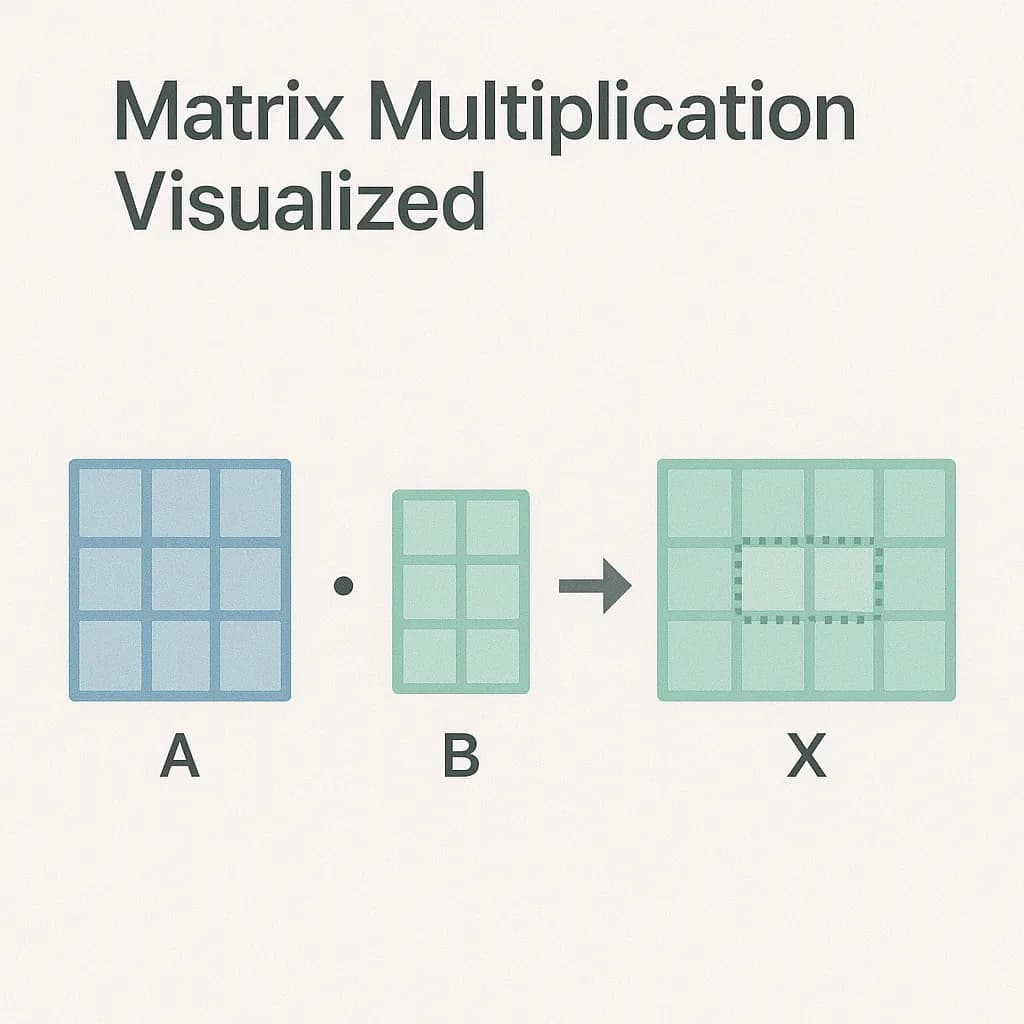
Interactive matrix multiplication calculator. Change dimensions, enter values, see step-by-step how each result is computed.
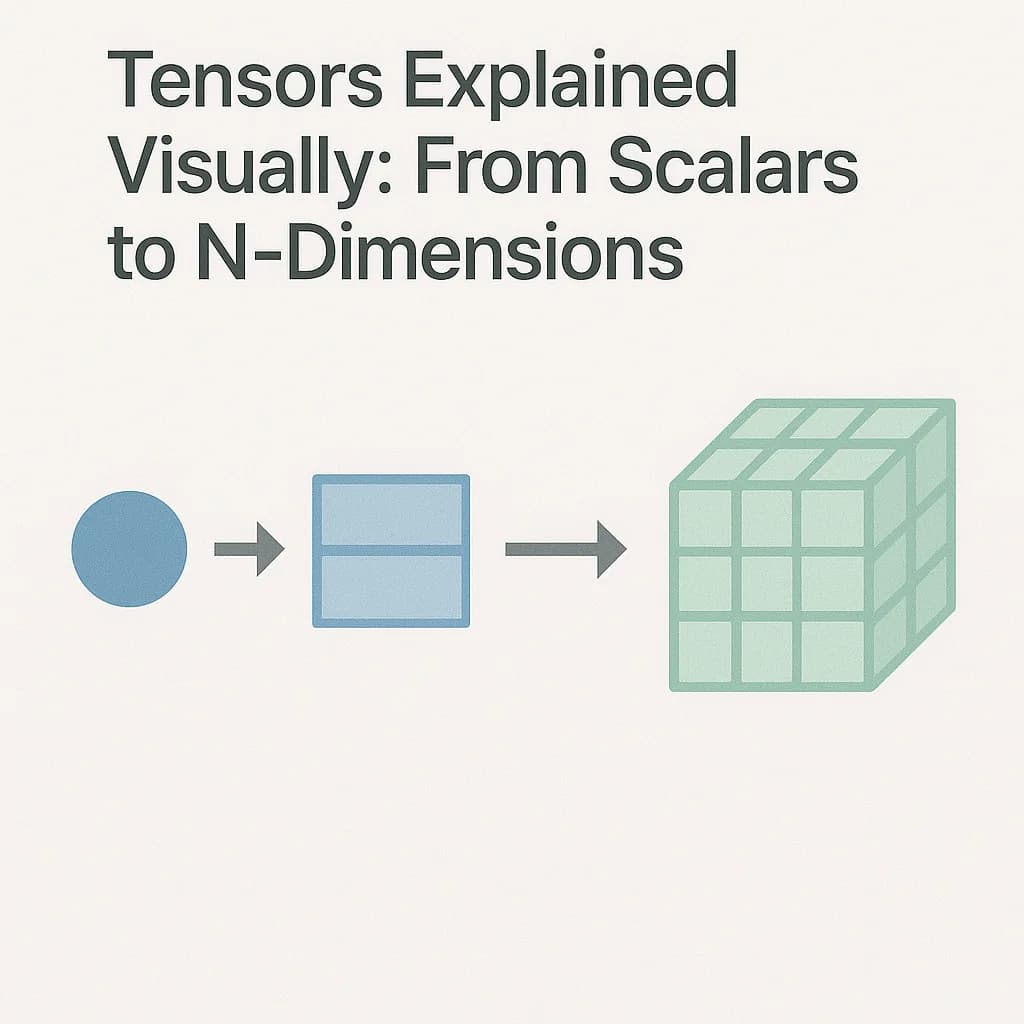
Understand tensors visually: scalar vs vector vs matrix vs tensor. Learn NumPy shape intuition with interactive examples and visualizations.
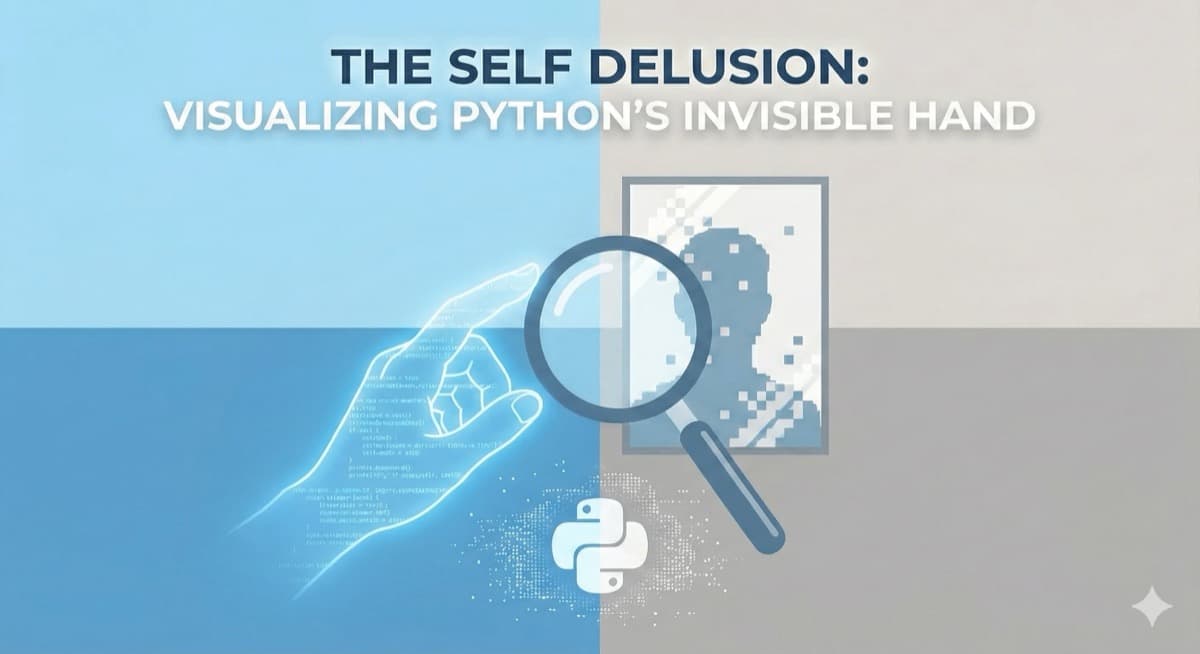
Finally understand Python's self keyword through an interactive puppet theater. Watch the invisible hand connect methods to objects in real-time.
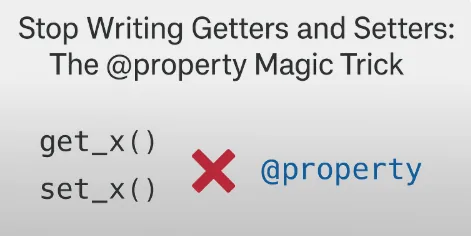
See why @property eliminates getters and setters. Interactive vending machine shows Pythonic encapsulation.
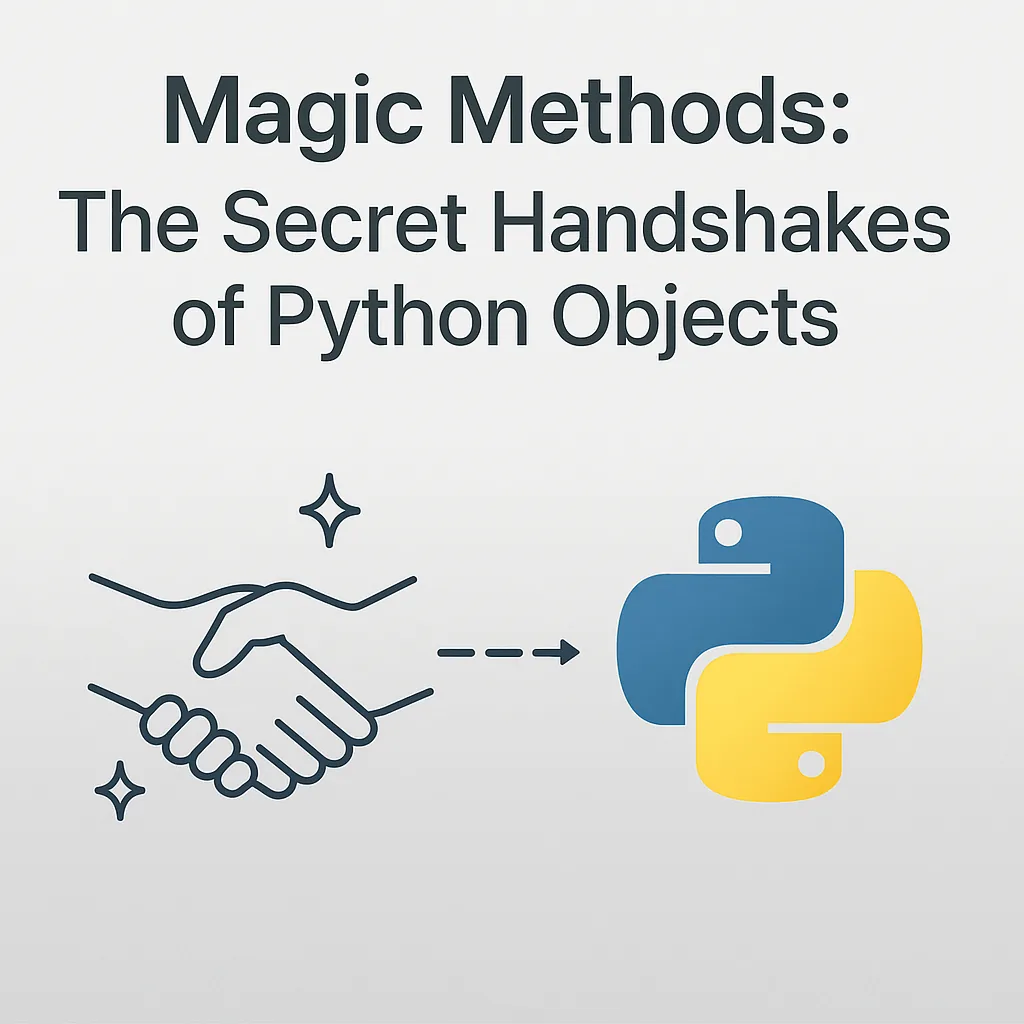
Master Python dunder methods through an interactive social club simulator. Learn __init__, __str__, __repr__, operator overloading, and protocol-oriented programming.
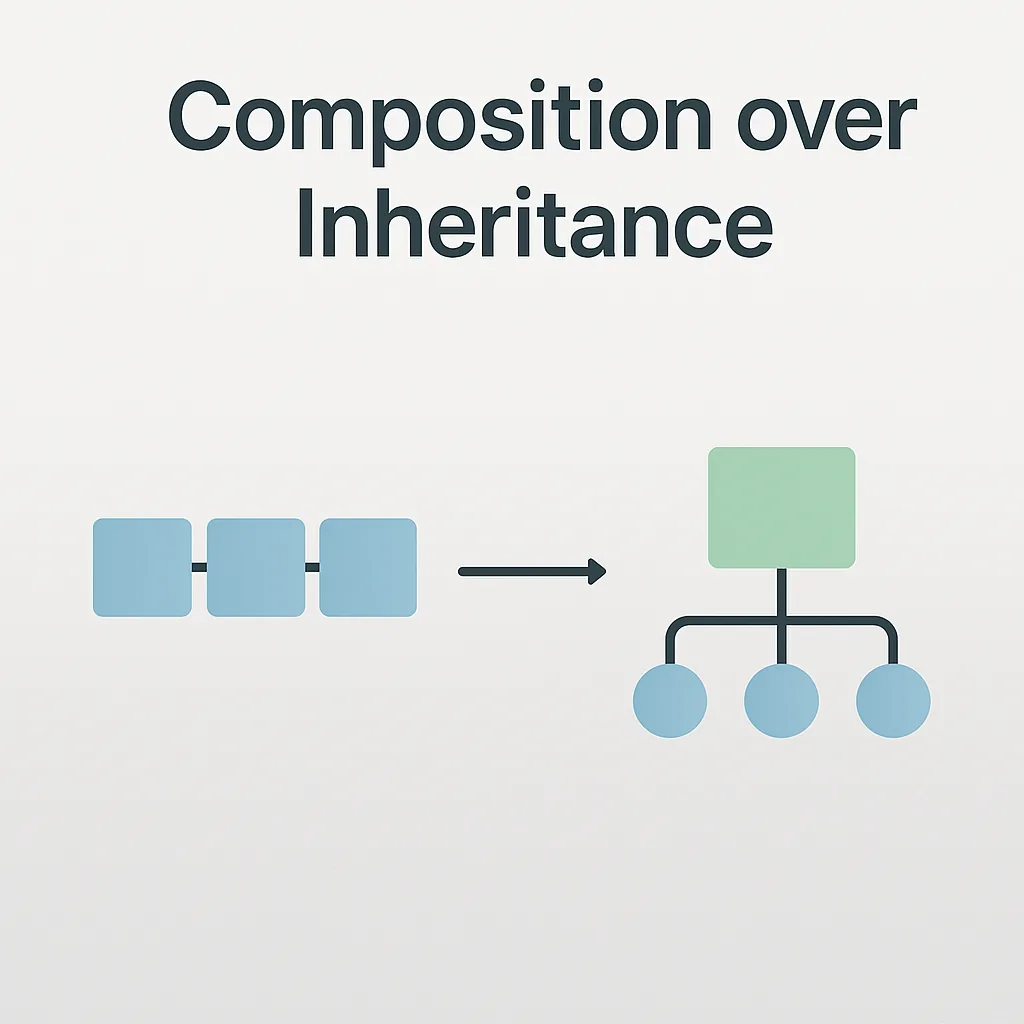
Learn why composition beats inheritance in Python through an interactive robot workshop. Build modular code like Lego bricks, not glued-together messes.
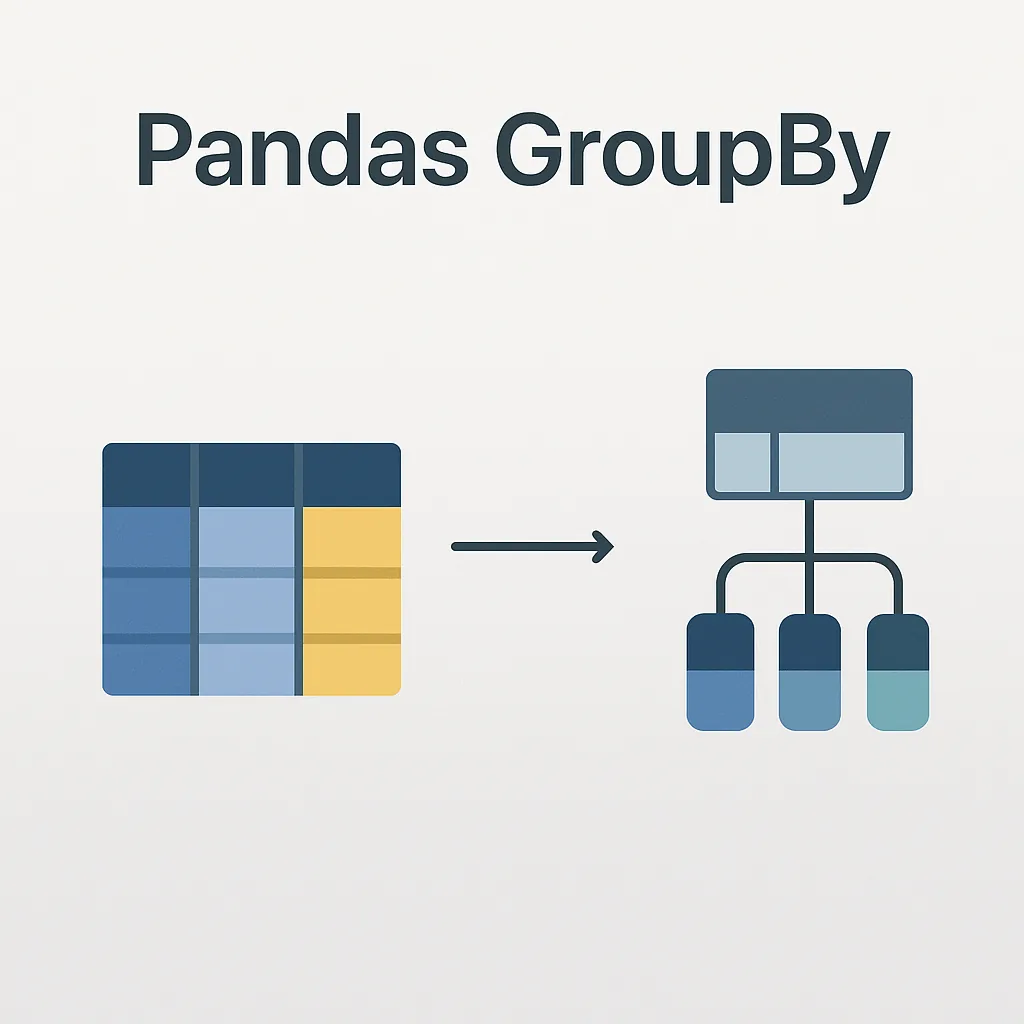
See how Pandas groupby works with Split-Apply-Combine. Interactive simulator shows why transform beats apply.

Your DataFrame is 10x larger than needed. See how object vs category and int64 vs int8 waste memory.
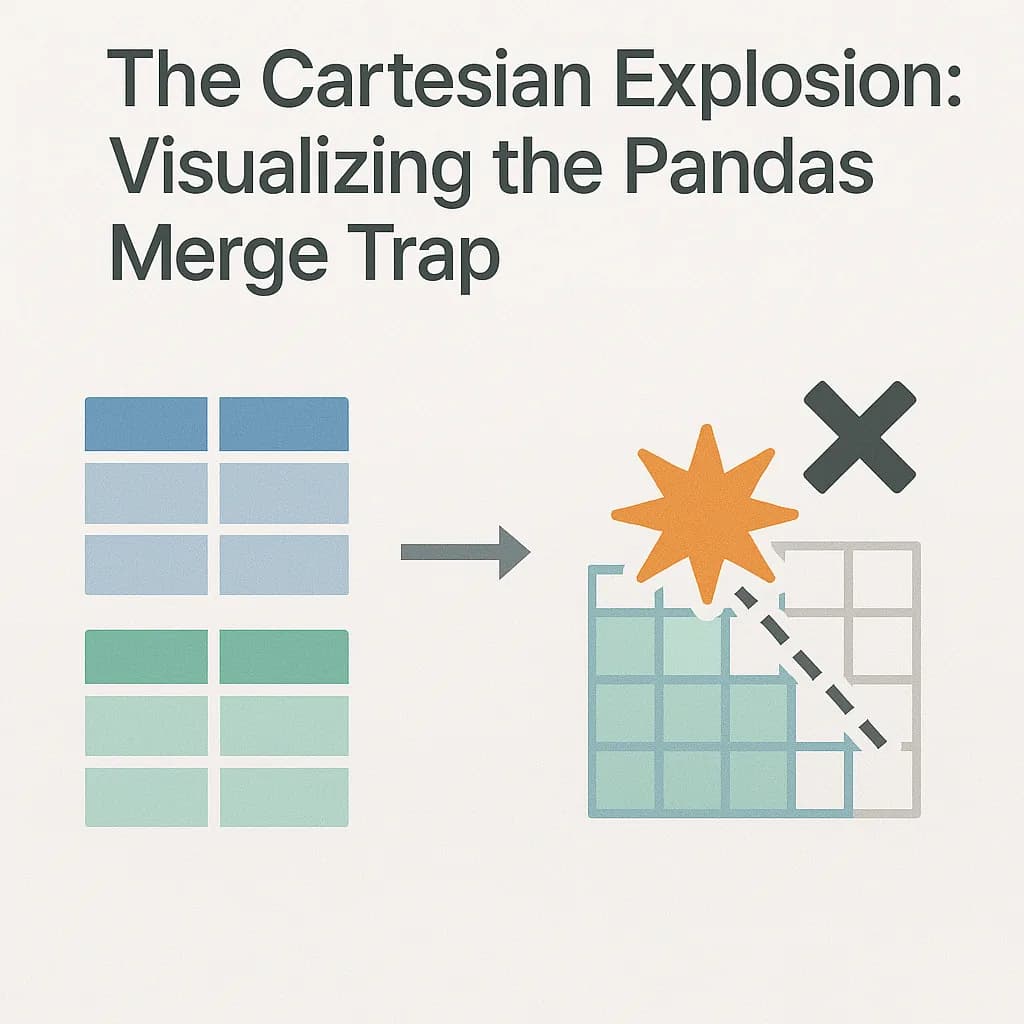
See why Pandas merge creates duplicate rows. Interactive dating app shows the Cartesian product explosion.

Visualize why O(log n) feels like magic. Watch binary search rip through a phonebook while linear search flips page by page.

Watch BFS spread like a sound wave while DFS dives like a snake. Interactive visual included.

Visualize why naive recursion explodes exponentially. Watch memoization turn chaos into order with an interactive Fibonacci simulator.

Visualize why O(n²) is inefficient through a heat map simulator. Watch brute force burn CPU cycles while sliding window glides smoothly.

Visualize backtracking through an interactive lock picker simulator. Watch how state reversibility saves memory while brute force creates infinite universes.

Visualize why RNNs forget and Transformers remember. Watch attention beams bypass the vanishing gradient problem in real-time.

Finally understand backpropagation through an interactive blame game simulator. Wiggle weights and watch error change in real-time.

See why dense neural networks fail at images. Watch 10,000 connections explode into spaghetti while a 9-parameter CNN filter wins.

Visualize why randomly killing neurons makes neural networks smarter. Interactive simulator shows how dropout prevents overfitting.

Finally understand the difference between NumPy reshape and transpose. Interactive ribbon simulator shows why reshape(-1) works but can't rotate images.

Finally understand NumPy axis with an interactive hydraulic press simulator. Watch axis=0, axis=1, and axis=2 crush a 3D array in real-time.

See why 'operands could not be broadcast together' happens. Interactive shape-matching simulator shows NumPy broadcasting rules.

Visualize why NumPy is 100x faster than Python loops. Watch a robot arm vs bulldozer race to finally understand SIMD and vectorization.

Interactive visualization of Byte Pair Encoding (BPE) tokenization. Discover why GPT thinks 9.11 > 9.9 and watch the tokenizer chop your text in real-time.

Interactive visualization of RNN vs Transformer architecture. See why RNNs forget and how Transformers solve the vanishing gradient problem.

See how LLMs decide which words matter. Interactive Query, Key, Value simulator shows self-attention in action.

Interactive visualization of Word2Vec and word embeddings. See why good and great were strangers in one-hot encoding but neighbors in vector space.

Drag points between classes and watch split quality update live. Interactive calculator shows why decision trees split where they do.
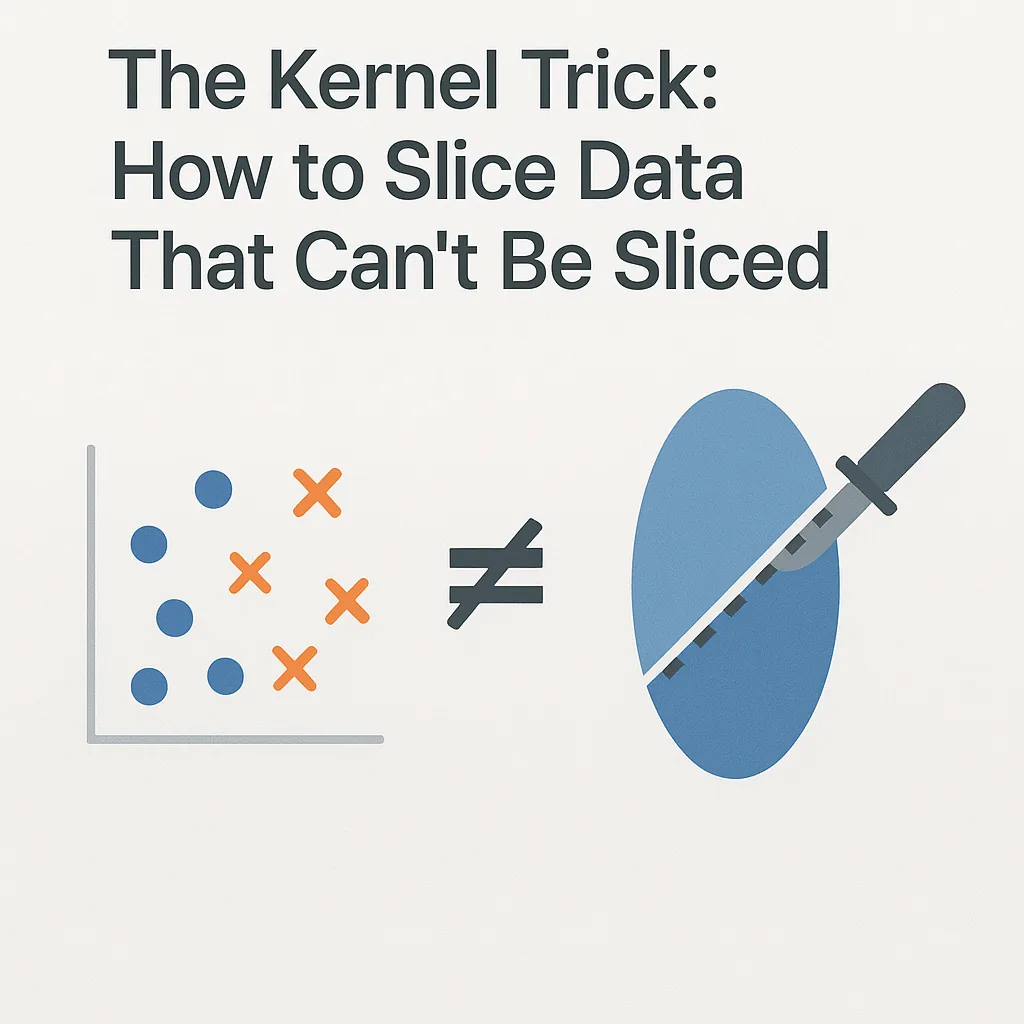
Interactive SVM kernel trick visualization. Draw non-linear data and watch it get lifted into higher dimensions where a simple line can separate it.

See why K-Means fails with bad initialization. Place centroids and watch the algorithm get trapped in local optima.

Drag the threshold slider and watch the confusion matrix update live. See the precision-recall tradeoff in action.